![]()
Gulls Home Page
Kittiwake Rissa tridactyla
![]()
Kittiwake Photo Index
|
|
Kittiwake Rissa tridactyla |
|
Regular passage migrant in highly variable numbers, and occasional storm-driven visitor.
See also: 'Defence of a temporary feeding territory by an inland juvenile Kittiwake Rissa tridactyla'
Kittiwakes are regarded as the most maritime of gulls but it has long been recognised that there is a purposeful overland migration during the early spring (e.g. Hume 1976). The species appears quite regularly at inland waters between February and April, and often the associated weather is fine, indicating that their arrivals at this season are by design rather than storm-driven. It is likely, however, that many birds pass overhead undetected when weather conditions are optimal, and that the largest numbers appear only when weather fronts impede their progress. This effect is dramatically illustrated in both the annual and monthly distributions of records within the West Midlands Region.
The annual distribution of Kittiwakes between 1986 and 2015 is presented in Figure 1.
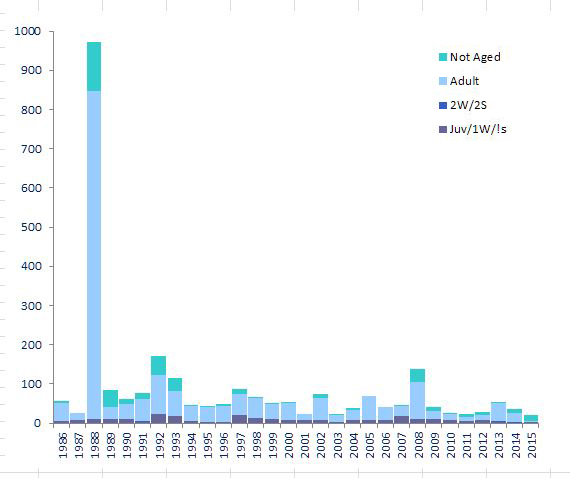
Figure 1. Annual distribution of Kittiwakes in the West Midlands Region, 1986 - 2015.
The huge influx of 1988 completely dominates Figure 1. Between late February and the end of March 1988, approaching 1000 birds were recorded, including 200 at Blithfield Reservoir (Staffs) on February 28th, 113 there on March 6th, and over 300 among a plethora of sites between March 12th and 14th. Strong north to north-westerly winds occurred during the movements of late February and late March, while the mid-March influx was associated with a stationary front oriented north-west to south-east across the Midlands. See West Midland Bird Report (1988) 55: 112 - 113 for further details.
To better illustrate the distribution during other years, Figure 2 displays the annual distribution with a truncated 'values' scale.
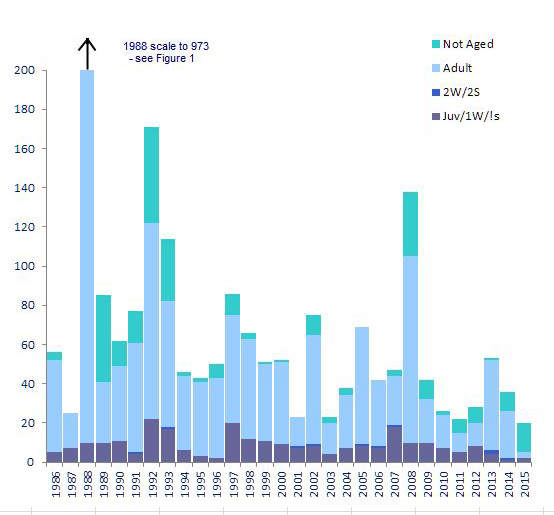
Figure 2. Annual distribution of Kittiwakes 1986 - 2015, plotted with truncated 'values' axis.
From Figure 2 it is evident that a typical year produces between 30 and 90 birds, and that 1992, 1993 and 2008 also produced above-average numbers. In contrast, numbers in 2010 were the fourth lowest since 1986 and the nationally poor breeding success of the species in recent years may well be adversely affecting its appearances in the West Midlands region (though between 58 and 80 individuals moved through at Draycote, Warks, during March / April 2018)..
The monthly distribution of Kittiwakes is displayed in Figure 3 (all years, 1986 to 2010) and Figure 4 (omitting 1988).
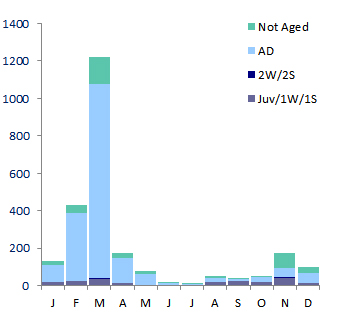
Figure 3. Monthly distribution of Kittiwakes in the West Midlands Region, 1986 - 2010.
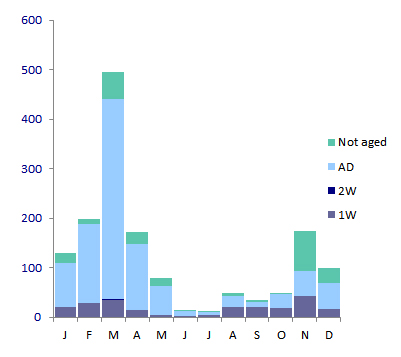
Figure 4. Monthly distribution of Kittiwakes 1986-2010 but omitting data from 1988.
In combination, Figures 3 and 4 demonstrate that the huge influx in 1988 occurred during the typical period for spring movements through the region, with the distribution of records during other years also displaying a distinct peak during February and March.
From Figure 4 it can be seen that adults predominate during these spring movements but that there is a more even balance of ages during the autumn. November is the most productive of the later months of the year and it is likely that, at this season, a higher proportion of Kittiwakes arrives as the result of displacement by coastal gales.
|
|
|
|
Home |
Mediterranean
| Laughing |
Franklin's |
Little |
Sabine's |
Bonaparte's |
Black-headed |
Ring-billed | Common |
Lesser Black-backed | |